r.green.hydro.planning
Calculate hydropower energy potential with user's recommendations
r.green.hydro.planning [-dc] elevation=name river=name efficiency=double len_plant=double len_min=double distance=double [p_min=double] [n=float] discharge_current=name [mfd=name] [discharge_natural=name] [percentage=double] [area=name] [buff=double] [points_view=name] [visibility_resolution=float] [n_points=integer] output_plant=name [output_vis=name] [--overwrite] [--verbose] [--quiet] [--qq] [--ui]
Example:
r.green.hydro.planning elevation=name river=name efficiency=1 len_plant=100 len_min=10 distance=0.5 discharge_current=name output_plant=name
grass.tools.Tools.r_green_hydro_planning(elevation, river, efficiency=1, len_plant=100, len_min=10, distance=0.5, p_min=10.0, n=3392, discharge_current, mfd=None, discharge_natural=None, percentage=None, area=None, buff=0, points_view=None, visibility_resolution=None, n_points=None, output_plant, output_vis=None, flags=None, overwrite=None, verbose=None, quiet=None, superquiet=None)
Example:
tools = Tools()
tools.r_green_hydro_planning(elevation="name", river="name", efficiency=1, len_plant=100, len_min=10, distance=0.5, discharge_current="name", output_plant="name")
This grass.tools API is experimental in version 8.5 and expected to be stable in version 8.6.
grass.script.run_command("r.green.hydro.planning", elevation, river, efficiency=1, len_plant=100, len_min=10, distance=0.5, p_min=10.0, n=3392, discharge_current, mfd=None, discharge_natural=None, percentage=None, area=None, buff=0, points_view=None, visibility_resolution=None, n_points=None, output_plant, output_vis=None, flags=None, overwrite=None, verbose=None, quiet=None, superquiet=None)
Example:
gs.run_command("r.green.hydro.planning", elevation="name", river="name", efficiency=1, len_plant=100, len_min=10, distance=0.5, discharge_current="name", output_plant="name")
Parameters
elevation=name [required]
Name of input elevation raster map
river=name [required]
Name of vector map with interesting segments of rivers
Vector map with the segments of the river that will be analysed
efficiency=double [required]
Efficiency [0-1]
Allowed values: 0-1
Default: 1
len_plant=double [required]
Maximum plant length [m]
Default: 100
len_min=double [required]
Minimum plant length [m]
Default: 10
distance=double [required]
Minimum distance among plants [m]
Default: 0.5
p_min=double
Minimum mean power [kW]
Default: 10.0
n=float
Number of operative hours per year [hours/year]
Default: 3392
discharge_current=name [required]
Current discharge [m3/s]
Name of input raster map
mfd=name
Minimum Flow Discharge (MFD) [m3/s]
Name of input raster map
discharge_natural=name
Natural discharge [m3/s]
Name of input raster map
percentage=double
MFD as percentage of natural discharge [%]
Allowed values: 0-100
area=name
Areas to exclude
Vector map with the areas that must be excluded (e.g. Parks)
buff=double
Buffer for areas to exclude [m]
Default: 0
points_view=name
Vector points of viewing position to exclude
Vector with the points that are used to compute the visibility
visibility_resolution=float
Resolution of the visibility map computation
n_points=integer
Number of points for the visibility
output_plant=name [required]
Name of output vector with potential segments
output_vis=name
Name of output vector with viewed areas
-d
Debug with intermediate maps
-c
Clean vector lines
--overwrite
Allow output files to overwrite existing files
--help
Print usage summary
--verbose
Verbose module output
--quiet
Quiet module output
--qq
Very quiet module output
--ui
Force launching GUI dialog
elevation : str | np.ndarray, required
Name of input elevation raster map
Used as: input, raster, name
river : str, required
Name of vector map with interesting segments of rivers
Vector map with the segments of the river that will be analysed
Used as: input, vector, name
efficiency : float, required
Efficiency [0-1]
Used as: double
Allowed values: 0-1
Default: 1
len_plant : float, required
Maximum plant length [m]
Used as: double
Default: 100
len_min : float, required
Minimum plant length [m]
Used as: double
Default: 10
distance : float, required
Minimum distance among plants [m]
Used as: double
Default: 0.5
p_min : float, optional
Minimum mean power [kW]
Used as: double
Default: 10.0
n : float, optional
Number of operative hours per year [hours/year]
Default: 3392
discharge_current : str | np.ndarray, required
Current discharge [m3/s]
Name of input raster map
Used as: input, raster, name
mfd : str | np.ndarray, optional
Minimum Flow Discharge (MFD) [m3/s]
Name of input raster map
Used as: input, raster, name
discharge_natural : str | np.ndarray, optional
Natural discharge [m3/s]
Name of input raster map
Used as: input, raster, name
percentage : float, optional
MFD as percentage of natural discharge [%]
Used as: double
Allowed values: 0-100
area : str, optional
Areas to exclude
Vector map with the areas that must be excluded (e.g. Parks)
Used as: input, vector, name
buff : float, optional
Buffer for areas to exclude [m]
Used as: double
Default: 0
points_view : str, optional
Vector points of viewing position to exclude
Vector with the points that are used to compute the visibility
Used as: input, vector, name
visibility_resolution : float, optional
Resolution of the visibility map computation
n_points : int, optional
Number of points for the visibility
output_plant : str, required
Name of output vector with potential segments
Used as: output, vector, name
output_vis : str, optional
Name of output vector with viewed areas
Used as: output, vector, name
flags : str, optional
Allowed values: d, c
d
Debug with intermediate maps
c
Clean vector lines
overwrite : bool, optional
Allow output files to overwrite existing files
Default: None
verbose : bool, optional
Verbose module output
Default: None
quiet : bool, optional
Quiet module output
Default: None
superquiet : bool, optional
Very quiet module output
Default: None
Returns:
result : grass.tools.support.ToolResult | None
If the tool produces text as standard output, a ToolResult object will be returned. Otherwise, None will be returned.
Raises:
grass.tools.ToolError: When the tool ended with an error.
elevation : str, required
Name of input elevation raster map
Used as: input, raster, name
river : str, required
Name of vector map with interesting segments of rivers
Vector map with the segments of the river that will be analysed
Used as: input, vector, name
efficiency : float, required
Efficiency [0-1]
Used as: double
Allowed values: 0-1
Default: 1
len_plant : float, required
Maximum plant length [m]
Used as: double
Default: 100
len_min : float, required
Minimum plant length [m]
Used as: double
Default: 10
distance : float, required
Minimum distance among plants [m]
Used as: double
Default: 0.5
p_min : float, optional
Minimum mean power [kW]
Used as: double
Default: 10.0
n : float, optional
Number of operative hours per year [hours/year]
Default: 3392
discharge_current : str, required
Current discharge [m3/s]
Name of input raster map
Used as: input, raster, name
mfd : str, optional
Minimum Flow Discharge (MFD) [m3/s]
Name of input raster map
Used as: input, raster, name
discharge_natural : str, optional
Natural discharge [m3/s]
Name of input raster map
Used as: input, raster, name
percentage : float, optional
MFD as percentage of natural discharge [%]
Used as: double
Allowed values: 0-100
area : str, optional
Areas to exclude
Vector map with the areas that must be excluded (e.g. Parks)
Used as: input, vector, name
buff : float, optional
Buffer for areas to exclude [m]
Used as: double
Default: 0
points_view : str, optional
Vector points of viewing position to exclude
Vector with the points that are used to compute the visibility
Used as: input, vector, name
visibility_resolution : float, optional
Resolution of the visibility map computation
n_points : int, optional
Number of points for the visibility
output_plant : str, required
Name of output vector with potential segments
Used as: output, vector, name
output_vis : str, optional
Name of output vector with viewed areas
Used as: output, vector, name
flags : str, optional
Allowed values: d, c
d
Debug with intermediate maps
c
Clean vector lines
overwrite : bool, optional
Allow output files to overwrite existing files
Default: None
verbose : bool, optional
Verbose module output
Default: None
quiet : bool, optional
Quiet module output
Default: None
superquiet : bool, optional
Very quiet module output
Default: None
DESCRIPTION
r.green.hydro.planning detects the position of the potential
hydropower plants including legal or ecological constraints and the
user's recommendations that can limit the technical potential to a more
sustainable one.
Deciding the range of plant length, the distance between plants, the
legal discharge we can exploit and the areas we want to exclude from the
calculation (ex. protected areas and the ones according to user's
recommendations), the module returns two different vector files with
planning available river segments, optimal position of the plants with
their powers and their intakes and restitutions.
NOTES
The difference between this module and r.green.hydro.optimal is that here we can consider a legal discharge and add areas which will be deleted from the considered streams map used to compute the potential plants.
Explanation of Parameters
-
elevation=name [required]
raster map, to calculate the gross head -
river=name [required]
vector on which the potential plants will be computed -
efficiency=double [required]
efficiency of the plant -
len_plant=double [required]
maximum length of the plant -
len_min=double [required]
minimum plant length -
distance=double [required]
minimum distance among the plants -
output_plant=name [required]
name of the output vector with the potential segments -
discharge_current=name [required]
current discharge; raster for each point of these rivers or raster map with the legal discharge
[required (only if discharge_current=currentdischarge)]:
- mfd=name
minimum amount of water to remain in the river to preserve the ecosystem
In this case, the discharge considered in the calculation will be the current discharge minus the MFD read in your input raster map.
The module r.green.hydro.discharge can compute the raster map of the MFD according to the legislation of some regions.
or
- discharge_natural=name
discharge of the river without considering the structures exploiting the water -
percentage=double
percentage used to calculate the MFD as an amount of the natural discharge -
area=name [optional]
areas to exclude from the planning of hydropower stations; only the rivers outside these excluded areas will be considered to compute the potential plants -
buff=double [optional]
buffer around the excluded areas -
points_view=name [optional]
input vector map with points of interest -
visibility_resolution=float [optional]
vision from the points of interest
An area corresponding to the fields of vision from the points of interest is computed, the latter correspond to visibility zones.
You can choose to exclude these areas or the areas where several visibility zones are superimposed. -
n_points=integer [optional]
number of points for the visibility corresponding to the number of visibility zones which are superimposed
For example, if this number is 3, the areas where two or less visibility zones are superimposed will be excluded. -
output_vis=name [optional]
name of the output vector with the viewed areas -
p_min=double [optional]
minimum mean power of the plant
The power (kW) is defined as:
P=η * ρ * g * Q * Δh
where η is the efficiency of the plant
ρ the density of water (1000 kg/m3)
g the gravity term (9,81 m/s2)
Q the discharge of the river (m3/s)
Δh the gross head of the considered segment (m)
The module maximizes the power over a given range by a brute-force search in order to examine all possible arrangements of Q and Δh. Thus, the potential segments can be shorter than the maximum plant length chosen because it depends on the maximization of the product Q * Δh. For each potential segment, the potential power is given in kW in attribute.
EXAMPLES
EXAMPLE 1
This example is based on the case-study of the Gesso and Vermenagna valleys located in the Piedmont Region, in South-West Italy, close to the Italian and French border.
In the map below you can see the file availablestreams of the considered
streams. The river segments already exploited by an existing plant do
not appear in the file.
This example is based on the case-study of Gesso and Vermenagna valleys
in the Natural Park of the Maritime Alps, Piedmont, Italy.
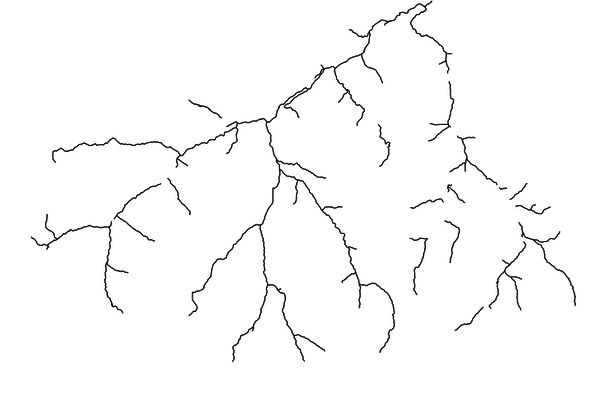
Input vector map available streams
First of all reset the region settings with g.region making them match the map elevation.
To create the map of this example, you can type in the following code in the command console or if you prefer you can only type in the main function names like r.green.hydro.planning, d.vect or v.buffer in the console and specify the other parameters of the code like elevation or efficiency by using the graphical user interface.
r.green.hydro.planning              \
    elevation=elevation                \
    river=availablestreams             \
    efficiency=0.9                     \
    len_plant=200                      \
    len_min=10                         \
    distance=100                       \
    output_plant=output_plant          \
    discharge_current=currentdischarge \
    mfd=mvf                            \
    area=nationalparks                 \
    buff=100                           \
    p_min=20

d.vect map=output_plant color=blue

v.buffer input=nationalparks output=buff_park distance=100

d.vect map=buff_park7 color=0:128:0 fill_color=144:238:144 width=1
As you can see in the output map below, this code calculates the energy potential for a range of plant length from 10 to 200 m and a distance between the plants of 100 m. The areas with the national park and a buffer of 100 m around it are excluded. The discharge considered here is the current discharge of rivers reduced by 30% of the Minimum Flow Discharge.
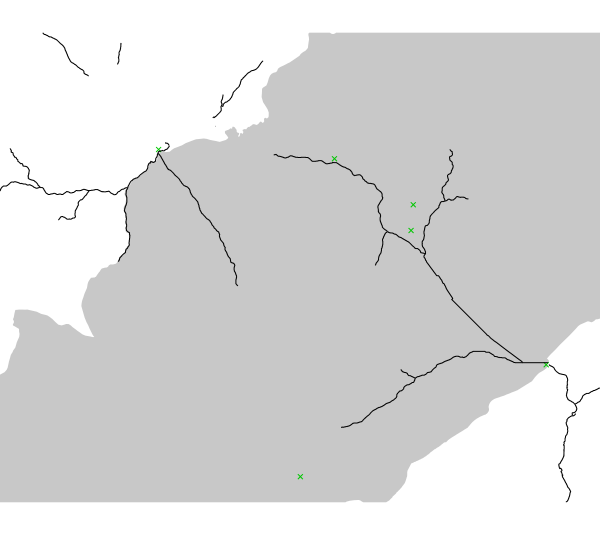
output vector map: superimposition of the potential segments vector file
(potentialplants, in blue) and the excluded national park (in green) and
the buffer (in dark green)
EXAMPLE 2
The second example is based on the case-study of Mis valley in Belluno province, Veneto, Italy.
Here is the vector file availablestreams of the considered streams. The
river segments already exploited by an existing plant do not appear in
the file.
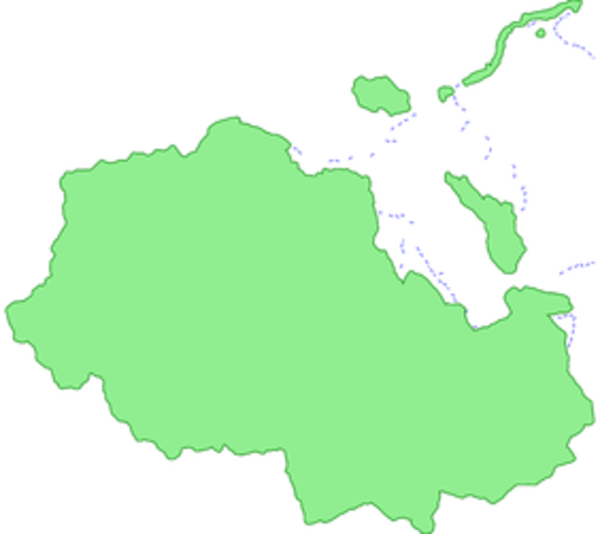
In superimposition, there are the vector map (in grey) of the national
park we want to exclude and the points of interest (in green) used to
create the visibility zones. These points were placed according to
experts' recommendations during a focus group made in Veneto region.
input vector map available streams with the national park and points of
interest
Points of interest are placed in the park so two different cases are
presented here:
1) The national park and a buffer of 200 m around it are excluded
2) The visibility zones from points of interest is excluded
1) In the first case, the code used is:
r.green.hydro.planning              \
    discharge_current=currentdischarge \
    discharge_natural=naturaldischarge \
    percentage=25.00                   \
    river=availablestreams             \
    elevation=elevation                \
    efficiency=0.8                     \
    len_plant=400                      \
    len_min=10                         \
    distance=150                       \
    area=nationalparks                 \
    buff=200                           \
    output_plant=potentialplants

d.vect map=potentialplants color=blue

v.buffer input=nationalparks output=buff_park distance=200

d.vect map=buff_park color=255:179:179 fill_color=255:179:179 width=1
This command calculates the energy potential for a range of plant length from 10 to 400 m and a distance between plants of 150 m. The areas with the national park and a buffer of 200 m around it are excluded. The discharge considered here is the current discharge of rivers subtracted by 25% of the natural discharge (the latter corresponds to the MFD).
output vector map: superimposition of the potential segments vector
file (potentialplants, in blue), the excluded national park (in grey)
and the buffer (in light red)
2) In the second case, the code used is:
r.green.hydro.planning                \
    discharge_current=currentdischarge   \
    mfd=mfd                              \
    river=availablestreams               \
    elevation=elevation                  \
    efficiency=0.8                       \
    len_plant=400                        \
    len_min=10                           \
    distance=150                         \
    points_view=pointsinterest           \
    n_points=1                           \
    output_plant=potentialplants         \
    output_vis=vis

d.vect map= potentialpoints color=red

d.vect map= potentialplants color=blue

d.vect map= pointsinterest color=green

d.vect map= vis color=144:224:144 fill_color=144:224:144 width=1
This command calculates the energy potential for a plant length range from 10 to 400 m and a distance between plants of 150 m. The visibility zones from each point of interest are excluded. The discharge considered here is the current discharge of rivers subtracted by the MFD. The MFD was calculated previously and computed in a raster map.
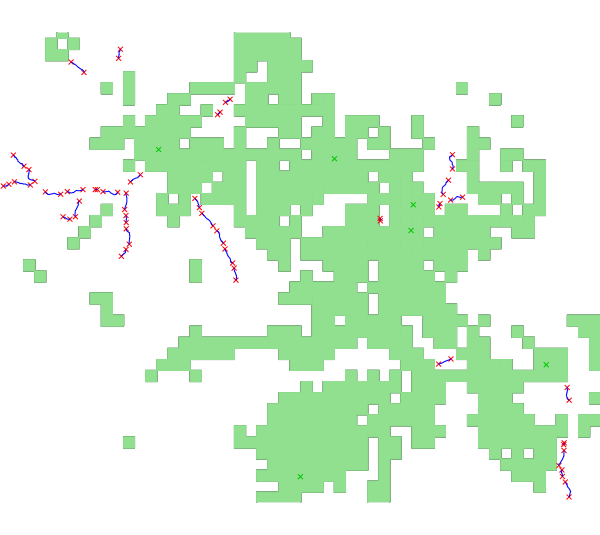
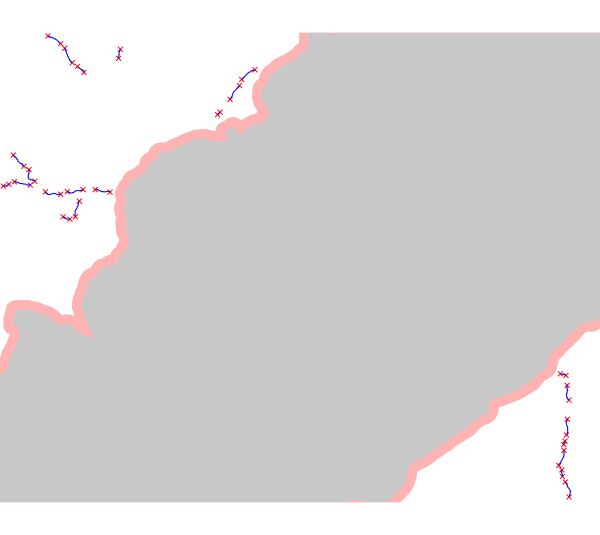
output vector map: superimposition of the potential segments vector
file (potentialplants, in blue), the points of interest (in green) and
the visibility zones (in light green)
SEE ALSO
r.green.hydro.discharge, r.green.hydro.delplants, r.green.hydro.theoretical, r.green.hydro.optimal, r.green.hydro.structure, r.green.hydro.technical, r.green.hydro.financial
AUTHORS
Giulia Garegnani (Eurac Research, Bolzano, Italy), Manual written by Julie Gros.
SOURCE CODE
Available at: r.green.hydro.planning source code
(history)
Latest change: Wednesday Mar 11 08:17:30 2026 in commit 2a14bbb