r.green.hydro.discharge
Calculate average natural discharge and minimum flow following regional law an
r.green.hydro.discharge [-dfp] [q_spec=name] q_river=name [k_b=name] [k_n=name] [rain=name] [k_matrix=name] [m_matrix=name] [a_matrix=name] [mfd=name] [a_river=name] elevation=name [river=name] [lakes=name] streams=name [corr_fact=name] [env_area=name] threshold=float [--overwrite] [--verbose] [--quiet] [--qq] [--ui]
Example:
r.green.hydro.discharge q_river=name elevation=name streams=name threshold=100000
grass.tools.Tools.r_green_hydro_discharge(q_spec=None, q_river, k_b=None, k_n=None, rain=None, k_matrix=None, m_matrix=None, a_matrix=None, mfd=None, a_river=None, elevation, river=None, lakes=None, streams, corr_fact=None, env_area=None, threshold=100000, flags=None, overwrite=None, verbose=None, quiet=None, superquiet=None)
Example:
tools = Tools()
tools.r_green_hydro_discharge(q_river="name", elevation="name", streams="name", threshold=100000)
This grass.tools API is experimental in version 8.5 and expected to be stable in version 8.6.
grass.script.run_command("r.green.hydro.discharge", q_spec=None, q_river, k_b=None, k_n=None, rain=None, k_matrix=None, m_matrix=None, a_matrix=None, mfd=None, a_river=None, elevation, river=None, lakes=None, streams, corr_fact=None, env_area=None, threshold=100000, flags=None, overwrite=None, verbose=None, quiet=None, superquiet=None)
Example:
gs.run_command("r.green.hydro.discharge", q_river="name", elevation="name", streams="name", threshold=100000)
Parameters
q_spec=name
Name of the specific discharge [l/s/km2]
q_river=name [required]
Name of raster map with the discharge along river [m3/s]
k_b=name
Name of raster map with kb parameter
k_n=name
Name of raster map with kn parameter
rain=name
Name of the specific with rain [mm]
k_matrix=name
Name of k area map with k parameter
m_matrix=name
Name of M area map with M parameter
a_matrix=name
Name of A area map with A parameter
mfd=name
Name of raster map with minimum flow along the river [m3/s]
a_river=name
Name of raster map with area of the basin along the river [m2]
elevation=name [required]
Name of input elevation raster map
river=name
Name of river network
Or data source for direct OGR access
lakes=name
Name of lakes network
Or data source for direct OGR access
streams=name [required]
Name of the new stream network
corr_fact=name
Name of corrective factors area map for environmental flow
env_area=name
Name of area with environmental restriction
threshold=float [required]
Minimum size of exterior watershed basin
Default: 100000
-d
Debug with intermediate maps
-f
compute the discharge in the river with q_spec=flow map
-p
compute the discharge in the river with q_spec computed as see manual
--overwrite
Allow output files to overwrite existing files
--help
Print usage summary
--verbose
Verbose module output
--quiet
Quiet module output
--qq
Very quiet module output
--ui
Force launching GUI dialog
q_spec : str | np.ndarray, optional
Name of the specific discharge [l/s/km2]
Used as: input, raster, name
q_river : str | type(np.ndarray) | type(np.array) | type(gs.array.array), required
Name of raster map with the discharge along river [m3/s]
Used as: output, raster, name
k_b : str | np.ndarray, optional
Name of raster map with kb parameter
Used as: input, raster, name
k_n : str | np.ndarray, optional
Name of raster map with kn parameter
Used as: input, raster, name
rain : str | np.ndarray, optional
Name of the specific with rain [mm]
Used as: input, raster, name
k_matrix : str | np.ndarray, optional
Name of k area map with k parameter
Used as: input, raster, name
m_matrix : str | np.ndarray, optional
Name of M area map with M parameter
Used as: input, raster, name
a_matrix : str | np.ndarray, optional
Name of A area map with A parameter
Used as: input, raster, name
mfd : str | type(np.ndarray) | type(np.array) | type(gs.array.array), optional
Name of raster map with minimum flow along the river [m3/s]
Used as: output, raster, name
a_river : str | type(np.ndarray) | type(np.array) | type(gs.array.array), optional
Name of raster map with area of the basin along the river [m2]
Used as: output, raster, name
elevation : str | np.ndarray, required
Name of input elevation raster map
Used as: input, raster, name
river : str, optional
Name of river network
Or data source for direct OGR access
Used as: input, vector, name
lakes : str, optional
Name of lakes network
Or data source for direct OGR access
Used as: input, vector, name
streams : str, required
Name of the new stream network
Used as: output, vector, name
corr_fact : str | np.ndarray, optional
Name of corrective factors area map for environmental flow
Used as: input, raster, name
env_area : str | np.ndarray, optional
Name of area with environmental restriction
Used as: input, raster, name
threshold : float, required
Minimum size of exterior watershed basin
Default: 100000
flags : str, optional
Allowed values: d, f, p
d
Debug with intermediate maps
f
compute the discharge in the river with q_spec=flow map
p
compute the discharge in the river with q_spec computed as see manual
overwrite : bool, optional
Allow output files to overwrite existing files
Default: None
verbose : bool, optional
Verbose module output
Default: None
quiet : bool, optional
Quiet module output
Default: None
superquiet : bool, optional
Very quiet module output
Default: None
Returns:
result : grass.tools.support.ToolResult | np.ndarray | tuple[np.ndarray] | None
If the tool produces text as standard output, a ToolResult object will be returned. Otherwise, None will be returned. If an array type (e.g., np.ndarray) is used for one of the raster outputs, the result will be an array and will have the shape corresponding to the computational region. If an array type is used for more than one raster output, the result will be a tuple of arrays.
Raises:
grass.tools.ToolError: When the tool ended with an error.
q_spec : str, optional
Name of the specific discharge [l/s/km2]
Used as: input, raster, name
q_river : str, required
Name of raster map with the discharge along river [m3/s]
Used as: output, raster, name
k_b : str, optional
Name of raster map with kb parameter
Used as: input, raster, name
k_n : str, optional
Name of raster map with kn parameter
Used as: input, raster, name
rain : str, optional
Name of the specific with rain [mm]
Used as: input, raster, name
k_matrix : str, optional
Name of k area map with k parameter
Used as: input, raster, name
m_matrix : str, optional
Name of M area map with M parameter
Used as: input, raster, name
a_matrix : str, optional
Name of A area map with A parameter
Used as: input, raster, name
mfd : str, optional
Name of raster map with minimum flow along the river [m3/s]
Used as: output, raster, name
a_river : str, optional
Name of raster map with area of the basin along the river [m2]
Used as: output, raster, name
elevation : str, required
Name of input elevation raster map
Used as: input, raster, name
river : str, optional
Name of river network
Or data source for direct OGR access
Used as: input, vector, name
lakes : str, optional
Name of lakes network
Or data source for direct OGR access
Used as: input, vector, name
streams : str, required
Name of the new stream network
Used as: output, vector, name
corr_fact : str, optional
Name of corrective factors area map for environmental flow
Used as: input, raster, name
env_area : str, optional
Name of area with environmental restriction
Used as: input, raster, name
threshold : float, required
Minimum size of exterior watershed basin
Default: 100000
flags : str, optional
Allowed values: d, f, p
d
Debug with intermediate maps
f
compute the discharge in the river with q_spec=flow map
p
compute the discharge in the river with q_spec computed as see manual
overwrite : bool, optional
Allow output files to overwrite existing files
Default: None
verbose : bool, optional
Verbose module output
Default: None
quiet : bool, optional
Quiet module output
Default: None
superquiet : bool, optional
Very quiet module output
Default: None
DESCRIPTION
r.green.hydro.discharge calculates the average natural discharge and the minimum flow discharge according to regional laws.
NOTES
The natural discharge is the discharge of the streams which doesn't
consider the existing power plants and the other structures exploiting
the water of the river.
The Minimal Flow Discharge (MFD) is the amount of water which has to
remain in the river to preserve the ecosystems. The legislation differs
in each region. The MFD can be considered as a percentage of the current
discharge, which is the discharge of the river considering the
structures exploiting the water. The current discharge is often
considered as the mean annual discharge.
However, a percentage of the current discharge cannot define precisely the MFD and each region has a different method to define it. For the moment, this module only considers the legislation applied on Piave basin in the Veneto region. New tabs with the legislation of other regions could be added.
The module computes two raster maps : the natural discharge and the MFD. On Piave basin, the natural discharge can be computed thanks to the input raster map with the values of specific discharge, and the MFD is calculated thanks to this formula :
QMFD = ( Kb + Kn ) * 177 * S0.85 * Qspec * 10-6
where Kb is the biological criticality index,
Kn is the naturalistic criticality index,
S is the catchment area, in km2,
Qspec is the specific flow-rate per unit area of the
catchment, in l/(s.km2)
Kb is typically within the range of 1-1.6; higher values are
chosen for a river whose aquatic ecosystem is considered to be of a
particular environmental value.
Kn is typically within the range of 0-0.6; higher values of
such index are used for basins having a particular naturalistic value,
for instance national parks.
The values of Kb and Kn are imposed by the Piave
River Catchment Authority (PRCA). They have different values depending
on homogeneous segments which can be found in a table made by the PRCA.
Also the values of Qspec depend on the area and are available
in such a table.
Thanks to three raster maps respectively with the values of Kb, Kn and Qspec, and also the elevation raster map and the streams vector map, the module creates the two raster maps with the values of MFD and average natural discharge.
EXAMPLE
This example is based on the case-study of Mis valley in Belluno province, Veneto, Italy.
Here is the map of the Mis valley with colored areas to define the Kn, Kb and Qspec values.
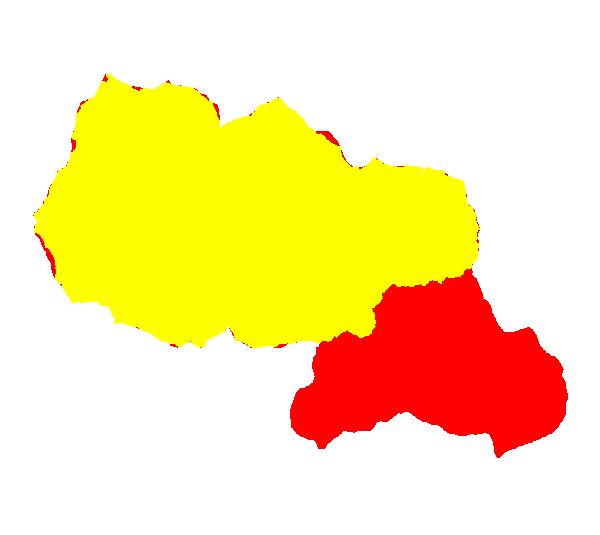
Picture which gathers the input raster maps with Kn,
Kb and Qspec values
According to the legislation for the Piave basin explained above, the
legal values for the Mis valley are :
Kn = 0.4 in the whole region (yellow and red zones)
Kb = 1.4 in the yellow zone and 1.6 in the red zone
Qspec = 44 l/(s.km2) in the yellow zone and 43
l/(s.km2) elsewhere (red and white zones)
These values are put in three different raster maps : q_spec, k_b and
k_n.
Here is the code used to create the raster maps with the MFD and the
natural discharge. The basins are considered with a threshold of 10000
m.
r.green.hydro.discharge q_spec=q_spec output_q_river=discharge k_b=k_b k_n=k_n output_mfd=mfd elevation=elevation output_streams=streams threshold=100000
The following picture gathers the two output raster maps mfd and discharge which look like each other (yellow background with colored points following the river and containing the values of discharge). For a better understanding, the following picture also shows the border of the Mis valley and the streams.
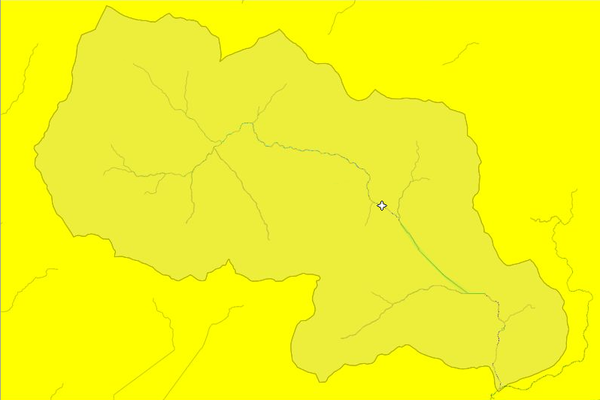
Picture which gathers the output raster maps with valued of MFD and
natural discharge, also showing the vector maps with the borders and
streams of Mis valley
The white point is queried in GRASS to know the values of MFD and natural discharge. The following picture shows these values in m3/s.
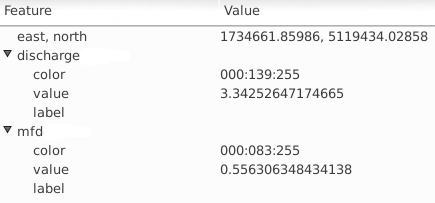
Values of MFD and natural discharge (in m3/s) at the white
point
SEE ALSO
r.green.hydro.delplants
r.green.hydro.theoretical
r.green.hydro.optimal
r.green.hydro.recommended
r.green.hydro.structure
r.green.hydro.technical
r.green.hydro.financial
REFERENCE
Allegato alla delibera n. 4/2004 del Comitato Istituzionale del 3 marzo
2004
Piano stralcio per la gestione delle risorse idriche del bacino del
Piave - Misure di Salvaguardia
from Autorità di bacino dei fiumi Isonzo, Tagliamento, Livenza, Piave,
Brenta-Bacchiglione
AUTHORS
Giulia Garegnani (Eurac Research, Bolzano, Italy), Sara Biscaini (University of Trento, Italy), manual written by Julie Gros.
SOURCE CODE
Available at: r.green.hydro.discharge source code
(history)
Latest change: Wednesday Mar 11 08:17:30 2026 in commit 2a14bbb