r.green.hydro.theoretical
Calculate the hydropower energy potential for each basin starting from discharge and elevation data. If existing plants are available it computes the potential installed power in the available part of the rivers.
r.green.hydro.theoretical [-d] elevation=name discharge=name [rivers=name] [lakes=name] threshold=string [basins=name] [stream=name] output=name [--overwrite] [--verbose] [--quiet] [--qq] [--ui]
Example:
r.green.hydro.theoretical elevation=name discharge=name threshold=0 output=name
grass.tools.Tools.r_green_hydro_theoretical(elevation, discharge, rivers=None, lakes=None, threshold="0", basins=None, stream=None, output, flags=None, overwrite=None, verbose=None, quiet=None, superquiet=None)
Example:
tools = Tools()
tools.r_green_hydro_theoretical(elevation="name", discharge="name", threshold="0", output="name")
This grass.tools API is experimental in version 8.5 and expected to be stable in version 8.6.
grass.script.run_command("r.green.hydro.theoretical", elevation, discharge, rivers=None, lakes=None, threshold="0", basins=None, stream=None, output, flags=None, overwrite=None, verbose=None, quiet=None, superquiet=None)
Example:
gs.run_command("r.green.hydro.theoretical", elevation="name", discharge="name", threshold="0", output="name")
Parameters
elevation=name [required]
Name of input elevation raster map
discharge=name [required]
Name of input river discharge raster map [m3/s]
rivers=name
Name of input vector map
Name of river network input vector map
lakes=name
Name of input vector map
Name of lakes input vector map
threshold=string [required]
Minimum size of exterior watershed basin
Default: 0
basins=name
Name of basin map obtained by r.watershed
stream=name
Name of stream map obtained by r.watershed
output=name [required]
Name of output vector map with basin potential [MWh]
-d
Debug with intermediate maps
--overwrite
Allow output files to overwrite existing files
--help
Print usage summary
--verbose
Verbose module output
--quiet
Quiet module output
--qq
Very quiet module output
--ui
Force launching GUI dialog
elevation : str | np.ndarray, required
Name of input elevation raster map
Used as: input, raster, name
discharge : str | np.ndarray, required
Name of input river discharge raster map [m3/s]
Used as: input, raster, name
rivers : str, optional
Name of input vector map
Name of river network input vector map
Used as: input, vector, name
lakes : str, optional
Name of input vector map
Name of lakes input vector map
Used as: input, vector, name
threshold : str, required
Minimum size of exterior watershed basin
Default: 0
basins : str | np.ndarray, optional
Name of basin map obtained by r.watershed
Used as: input, raster, name
stream : str | np.ndarray, optional
Name of stream map obtained by r.watershed
Used as: input, raster, name
output : str, required
Name of output vector map with basin potential [MWh]
Used as: output, vector, name
flags : str, optional
Allowed values: d
d
Debug with intermediate maps
overwrite : bool, optional
Allow output files to overwrite existing files
Default: None
verbose : bool, optional
Verbose module output
Default: None
quiet : bool, optional
Quiet module output
Default: None
superquiet : bool, optional
Very quiet module output
Default: None
Returns:
result : grass.tools.support.ToolResult | None
If the tool produces text as standard output, a ToolResult object will be returned. Otherwise, None will be returned.
Raises:
grass.tools.ToolError: When the tool ended with an error.
elevation : str, required
Name of input elevation raster map
Used as: input, raster, name
discharge : str, required
Name of input river discharge raster map [m3/s]
Used as: input, raster, name
rivers : str, optional
Name of input vector map
Name of river network input vector map
Used as: input, vector, name
lakes : str, optional
Name of input vector map
Name of lakes input vector map
Used as: input, vector, name
threshold : str, required
Minimum size of exterior watershed basin
Default: 0
basins : str, optional
Name of basin map obtained by r.watershed
Used as: input, raster, name
stream : str, optional
Name of stream map obtained by r.watershed
Used as: input, raster, name
output : str, required
Name of output vector map with basin potential [MWh]
Used as: output, vector, name
flags : str, optional
Allowed values: d
d
Debug with intermediate maps
overwrite : bool, optional
Allow output files to overwrite existing files
Default: None
verbose : bool, optional
Verbose module output
Default: None
quiet : bool, optional
Quiet module output
Default: None
superquiet : bool, optional
Very quiet module output
Default: None
DESCRIPTION
r.green.hydro.theoretical calculates for each basin the theoretical
maximum hydropower energy potential based on the input raster files with
discharge data along a river network and digital terrain elevation
models of the considered region.
If there are already existing plants, the function computes the
potential installed power in the available parts of the rivers.
This module returns two output vector maps with the available river
segments and the optimal position of the plants with their potential
maximum powers, intakes and restitutions.
In this module the output is the theoretical maximum hydropower energy
that can be converted in the ideal case without considering the
efficiency of energy transformation.
NOTES
The required inputs are the elevation raster map, the river discharge
raster map and the value for the minimum size of the exterior watershed
basin.
You can optionally add vector maps of existing river networks and lakes
that will be considered in the calculation and make the output more
realistic.
Instead of the minimum size of the exterior watershed basin you can also
enter the basin and stream maps created by r.watershed.
EXPLANATION
The maximum potential hydropower establishes the theoretical maximum of
energy that the study basin can produce assuming that all water
resources are used to produce energy.
In real life this situation does not arise, because of environmental
flows, other water uses and economic cost analysis.
The underlying methods of calculation explained below are based on the considerations and formulas used in the article "A GIS-based assessment of maximum potential hydropower production in La Plata Basin under global changes" written by M. Peviani, I. Popescu, L. Brandimarte, J.Alterach and P. Cuya.
The maximum potential hydropower at subbasin scale can be computed as the sum of two components:
- upstream subbasin potential
- subbasin own potential
According to the general schematization in the figure below, point A is
the closure point of the upstream subbasins (named UPSTREAM 1, UPSTREAM
2 and UPSTREAM 3).
The three rivers belonging to the three upstream basins merge into the
common river of the downstream basin in point A (named Upstreamclosure
point).
The downstream basin is bounded by the two closure points A and B.
The scheme divides the subbasins in upper portions, whose energy
production is only given by their own potential and a lower portion,
whose energy production is the sum of the two components, own potential
and the potential given by the flow coming from the upper portions.
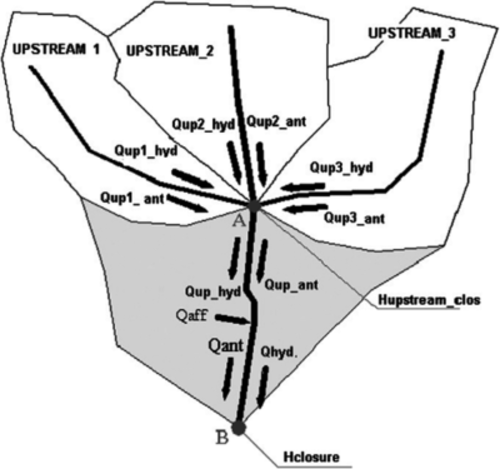
Subbasin scheme to calculate maximum potential hydropower
The maximum potential hydropower for the upstream subbasins is given by the energy formula applied to the upstream inflows:
Eown_max = conv * g * η * Qup_hydro * (Hmean - Hclosure)
where conv is the adimensional conversion factor
to calculate energy in GWh (conv = 0.00876);
g is a gravity constant (9.81 m/s2);
η is the overall electrical efficiency;
Qup_hydro is the mean annual discharge at the closure
section for the upstream subbasin;
Hmean is the mean elevation of the upstream subbasin
calculated from the hypsographic curve, using the statistical tool of
Arc-GIS;
Hclosure is the elevation at the closure point (point A in
the figure);
The downstream lower subbasin (between point A and B in the figure) has both energy components: the potential from the upstream subbasins and its own potential. The own potential is calculated taking into account the discharge coming from the sides of the downstream lower subbasin and the difference between the elevation of the lower subbasin and the elevation at the closure point (point B in the figure):
Eown_max = conv * g * η * Qaff * (Hmean - Hclosure)
where Qaff is the afferent discharge
(own lower subbasin discharge). The afferent discharge is the
difference of the discharge observed at the closure section (point B
in the figure) and the sum of the upstream discharges;
Hmean is the elevation of lower subbasin;
Hclosure is the elevation at closure point (point B in the
figure);
The upstream component to the potential of the downstream lower subbasin is calculated taking into account the discharge coming from the upstream subbasins and the difference between the elevation of the upstream closure point (point A in the figure) and the elevation at the basin closure (point B in the figure):
Eup_max = conv * g * η * ∑Qup_hydro * (Hup_closure - Hclosure)
where Qup_hydro is the sum of the mean
annual discharges coming from the upstream subbasins;
Hup_closure is the elevation at the upstream closure point
(point A in the figure);
Hclosure is the elevation at closure point (point B in the
figure);
The total maximum hydropower potential of the overall given basin is the sum of the different contributions computed at the subbasin level:
Etotal_max = Eown_max + Eup_max
EXAMPLES
This example is based on the case-study of the Gesso and Vermenagna valleys located in the Piedmont Region, in South-West Italy, close to the Italian and French border.
In the map below you can see the input files elevation and natural discharge.
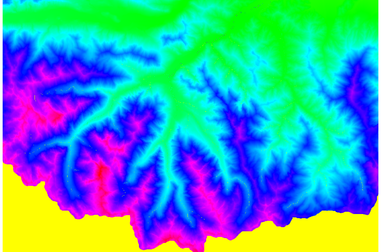
input raster map with elevation and natural discharge
For a faster run of this example, the input maps elevation and discharge
are limited to the section that can be modified by
r.green.hydro.theoretical using the code
r.mask vector=boundary.
To create the map of this example, you can type in the following code in the command console or if you prefer you can only type in the main function r.green.hydro.theoretical in the console and specify the other parameters of the code like elevation or discharge by using the graphical user interface.
r.green.hydro.theoretical elevation=elevation discharge=naturaldischarge rivers=streams lakes=lakes basins=basin stream=stream output=out
In the map below, you can see the output vector map with the basin potential.
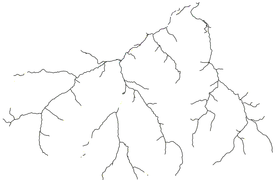
output vector map with basin potential
SEE ALSO
r.green.hydro.discharge
r.green.hydro.delplants
r.green.hydro.optimal
r.green.hydro.recommended
r.green.hydro.structure
r.green.hydro.technical
r.green.hydro.financial
AUTHORS
Giulia Garegnani (Eurac Research, Bolzano, Italy), Manual written by Sabrina Scheunert.
SOURCE CODE
Available at: r.green.hydro.theoretical source code
(history)
Latest change: Wednesday Mar 11 08:17:30 2026 in commit 2a14bbb