r.green.hydro.optimal
Detect the position of the potential hydropower plants that can produce the highest possible power
r.green.hydro.optimal [-dc] elevation=name discharge=name river=name len_plant=float len_min=float distance=float [p_max=float] p_min=float output_plant=name [output_point=name] efficiency=float [--overwrite] [--verbose] [--quiet] [--qq] [--ui]
Example:
r.green.hydro.optimal elevation=name discharge=name river=name len_plant=10000 len_min=10 distance=0.5 p_min=10.0 output_plant=name efficiency=1
grass.tools.Tools.r_green_hydro_optimal(elevation, discharge, river, len_plant=10000, len_min=10, distance=0.5, p_max=None, p_min=10.0, output_plant, output_point=None, efficiency=1, flags=None, overwrite=None, verbose=None, quiet=None, superquiet=None)
Example:
tools = Tools()
tools.r_green_hydro_optimal(elevation="name", discharge="name", river="name", len_plant=10000, len_min=10, distance=0.5, p_min=10.0, output_plant="name", efficiency=1)
This grass.tools API is experimental in version 8.5 and expected to be stable in version 8.6.
grass.script.run_command("r.green.hydro.optimal", elevation, discharge, river, len_plant=10000, len_min=10, distance=0.5, p_max=None, p_min=10.0, output_plant, output_point=None, efficiency=1, flags=None, overwrite=None, verbose=None, quiet=None, superquiet=None)
Example:
gs.run_command("r.green.hydro.optimal", elevation="name", discharge="name", river="name", len_plant=10000, len_min=10, distance=0.5, p_min=10.0, output_plant="name", efficiency=1)
Parameters
elevation=name [required]
Name of input elevation raster map
discharge=name [required]
Name of river discharge [m^3/s]
Name of input raster map
river=name [required]
Name of vector map with interested segments of rivers
Or data source for direct OGR access
len_plant=float [required]
Maximum length of the plant [m]
Default: 10000
len_min=float [required]
Minimum length of the plant [m]
Default: 10
distance=float [required]
Minimum distance among plants [m]
Default: 0.5
p_max=float
Maximum mean power [kW]
p_min=float [required]
Minimum mean power [kW]
Default: 10.0
output_plant=name [required]
Name of output vector map with potential power for each river segment [kW]
Name for output vector map
output_point=name
Name of output vector map with potential power intakes and restitution [kW]
Name for output vector map
efficiency=float [required]
Efficiency [-]
Default: 1
-d
Debug with intermediate maps
-c
Clean vector lines
--overwrite
Allow output files to overwrite existing files
--help
Print usage summary
--verbose
Verbose module output
--quiet
Quiet module output
--qq
Very quiet module output
--ui
Force launching GUI dialog
elevation : str | np.ndarray, required
Name of input elevation raster map
Used as: input, raster, name
discharge : str | np.ndarray, required
Name of river discharge [m^3/s]
Name of input raster map
Used as: input, raster, name
river : str, required
Name of vector map with interested segments of rivers
Or data source for direct OGR access
Used as: input, vector, name
len_plant : float, required
Maximum length of the plant [m]
Default: 10000
len_min : float, required
Minimum length of the plant [m]
Default: 10
distance : float, required
Minimum distance among plants [m]
Default: 0.5
p_max : float, optional
Maximum mean power [kW]
p_min : float, required
Minimum mean power [kW]
Default: 10.0
output_plant : str, required
Name of output vector map with potential power for each river segment [kW]
Name for output vector map
Used as: output, vector, name
output_point : str, optional
Name of output vector map with potential power intakes and restitution [kW]
Name for output vector map
Used as: output, vector, name
efficiency : float, required
Efficiency [-]
Default: 1
flags : str, optional
Allowed values: d, c
d
Debug with intermediate maps
c
Clean vector lines
overwrite : bool, optional
Allow output files to overwrite existing files
Default: None
verbose : bool, optional
Verbose module output
Default: None
quiet : bool, optional
Quiet module output
Default: None
superquiet : bool, optional
Very quiet module output
Default: None
Returns:
result : grass.tools.support.ToolResult | None
If the tool produces text as standard output, a ToolResult object will be returned. Otherwise, None will be returned.
Raises:
grass.tools.ToolError: When the tool ended with an error.
elevation : str, required
Name of input elevation raster map
Used as: input, raster, name
discharge : str, required
Name of river discharge [m^3/s]
Name of input raster map
Used as: input, raster, name
river : str, required
Name of vector map with interested segments of rivers
Or data source for direct OGR access
Used as: input, vector, name
len_plant : float, required
Maximum length of the plant [m]
Default: 10000
len_min : float, required
Minimum length of the plant [m]
Default: 10
distance : float, required
Minimum distance among plants [m]
Default: 0.5
p_max : float, optional
Maximum mean power [kW]
p_min : float, required
Minimum mean power [kW]
Default: 10.0
output_plant : str, required
Name of output vector map with potential power for each river segment [kW]
Name for output vector map
Used as: output, vector, name
output_point : str, optional
Name of output vector map with potential power intakes and restitution [kW]
Name for output vector map
Used as: output, vector, name
efficiency : float, required
Efficiency [-]
Default: 1
flags : str, optional
Allowed values: d, c
d
Debug with intermediate maps
c
Clean vector lines
overwrite : bool, optional
Allow output files to overwrite existing files
Default: None
verbose : bool, optional
Verbose module output
Default: None
quiet : bool, optional
Quiet module output
Default: None
superquiet : bool, optional
Very quiet module output
Default: None
DESCRIPTION
r.green.hydro.optimal detects the position of the potential hydropower plants that can produce the highest possible power. Deciding the range of plant length and the distance between plants, the module returns two vector maps with the segments of rivers exploited by the potential plants and with the intakes and restitution of these plants. The module computes the potential plants in order to maximize the power that can be produced.
NOTES
The three input files are the rivers considered (vector), the discharge for each point of this river (raster) and the elevation raster map to calculate the gross head.
The power is defined as:
P=η * ρ * g * Q * Δh
where η is the efficiency of the plant
ρ the density of water (1000 kg/m3)
g the gravity term (9,81 m/s2)
Q the discharge of the river
Δh the gross head of the considered segment
The module maximizes the power over a given range by a brute-force search in order to examine all possible arrangements of Q and Δh. Thus, the potential segments can be shorter than the maximum plant length chosen because it depends on the maximization of the product Q * Δh.
For each potential segment, the potential power is given in kW in attribute.
EXAMPLE
This example is based on the case-study of Gesso and Vermenagna valleys in the Natural Park of the Maritime Alps, Piedmont, Italy.
Here is the vector file availablestreams of the interested streams in which we want to compute the potential hydropower plants. The river segments already exploited by an existing plant do not appear in the file.
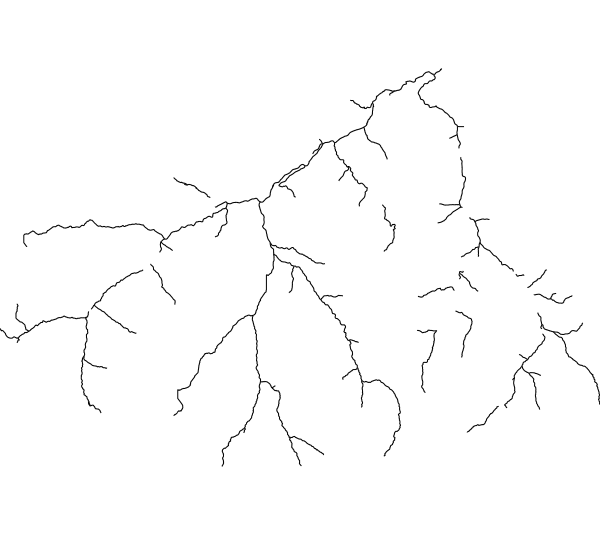
Input vector map available streams
The following command computes the potential plants for a plant length range from 10 to 800 m and a distance between plants of 800 m :
r.green.hydro.optimal
discharge=discharge
river=availablestreams
elevation=elevation
len_plant=800
distance=800
output_plant=potentialsegments
output_point=potentialpoints

d.vect map= potentialpoints color=red

d.vect map= potentialplants color=blue
The output vector maps are shown in the following picture which gathers the potential segments vector map (potentialplants, in blue) and the potential intakes and restitution vector map (potentialpoints, in red)
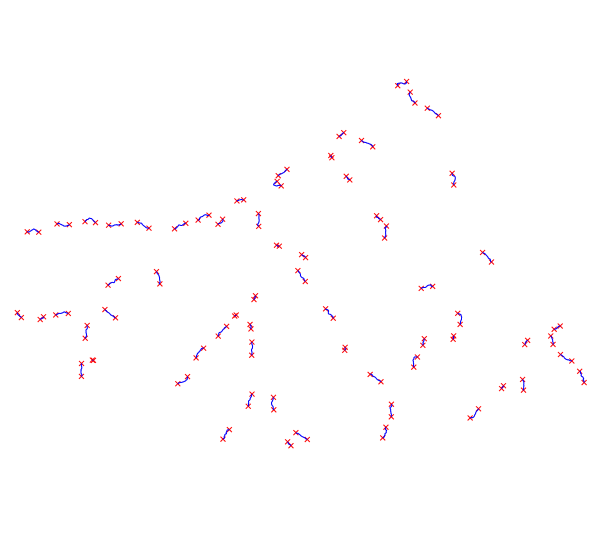
Output vector maps potentialplants (in blue) and potentialpoints (in
red)
SEE ALSO
r.green.hydro.discharge
r.green.hydro.delplants
r.green.hydro.theoretical
r.green.hydro.recommended
r.green.hydro.structure
r.green.hydro.technical
r.green.hydro.financial
AUTHORS
Giulia Garegnani (Eurac Research, Bolzano, Italy), Manual written by Julie Gros.
SOURCE CODE
Available at: r.green.hydro.optimal source code
(history)
Latest change: Wednesday Mar 11 08:17:30 2026 in commit 2a14bbb